Introduction
Define what sampling means, with a strong focus/emphasis on what it means to sample in a spatial perspective.
- Sampling is a way to gather data of a smaller area that can represent the larger whole picture in a fairly accurate manner.
List out the various sampling techniques.
- There are a few different sampling techniques.
- Random Sampling- Taking random small samples throughout the large study area.
- Systematic Sampling- Creating a system and/or pattern to decide which points/areas to include in the sample
- Stratified Sampling- Taking points/areas from a subgroup within the larger study area.
What is the objective(s) of the lab
- The objectives of this lab was to research and understand the various sampling techniques I have listed above. As a group we chose the most appropriate sampling technique to measure an area. We then used previous knowledge team work and communication to execute this lab.
Methods
What is the sampling technique you chose to use? Why? What other methods is this similar to and why did you not use them.
- The sampling method we chose to use was systematic sampling. We chose this method because we all felt confident in this sampling technique and agreed it would adequately represent the study area as a whole. Systematic sampling is very similar to stratified systematic sampling in the sense that there is still an organized system to obtaining the specific points/areas, but these points/areas are restricted to areas of interest out of the whole study site. We did not use the stratified systematic sampling because as a group we felt it would leave out areas that were crucial to understanding the bigger picture.
List out the location of your sample plot. Be as specific as possible going from general to specific.
- Our sample plot was located in Eau Claire Wisconsin, on campus of UW-Eau Claire. More specifically the court yard of Phillips in a planters box located in the left column of planters boxes, farthest one back.
What are the materials you are using?
- The materials we used were:
- Planters box
- Snow
- String
- Tacs
- Pen
- Meter stick
- Leveler
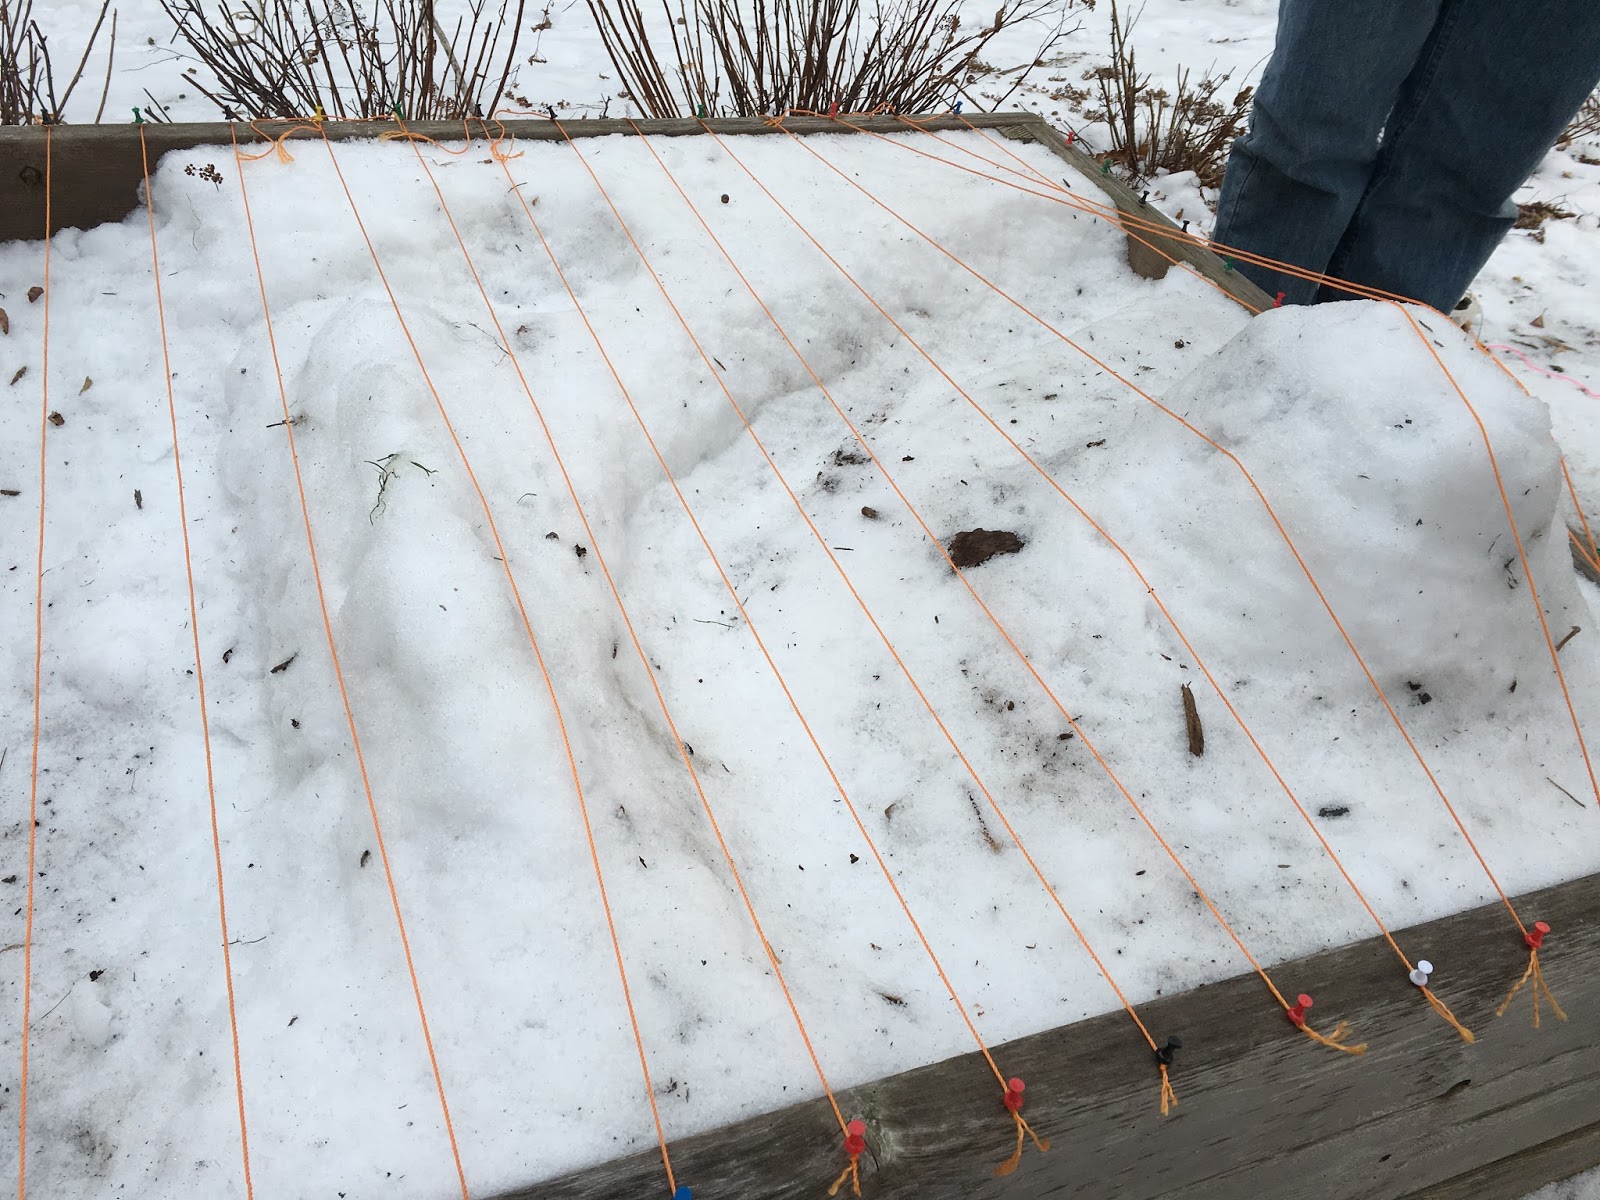
How did you set up your sampling scheme? Spacing?
- We used half of the planters box and used a previous landscape that was already created. We then modified it to the best of our abilities (conditions were icy so only minor changes were made). Our entire landscape was 112 centimeters (x axis) by 88 cm (y axis). We then implemented our systematic sampling using string and created horizontal lines across the landscape every 8 centimeters which were to represent the y values on a grid. These were pinned down to the planters box by tacs. We then measured every 8 centimeters for x values and used tacs to represent those values. Essentially we created a grid and where each line intersected we would measure the z value.
How did you address your zero elevation (sea level)?
- As a group we decided that our zero elevation should be level with the planters box as we thought this may make taking measurements slightly easier.
How was the data entered/recorded? Why did you choose this data entry method?
- As measurements were being made we recorded the numbers on a spreadsheet in a x, y, z fashion. The numbers were recorded to the closest 10th of a centimeter. Our data will later be entered into xcel.


Pictures are all from Audrey's smart phone.
Results/Discussion
What was the resulting number of sample points you recorded?
- 180 total sample points were recorded.
Discuss the sample values? What was the minimum value, the maximum, the mean, standard deviation, etc.
- Minimum value: -10 centimeters
- Maximum value: 19.5 centimeters
- Mean value: -0.53 centimeters
Did the sampling relate to the method you chose, or could have another method met your objective better.
- I think the sampling we did related very well to systematic method we chose. We may have been able to create a better grid by creating strings perpendicular to the horizontal strings.
Did your sampling technique change over the survey, or did your group stick to the original plan. How does this relate to your resulting data set?
- We took our measurements the same way each time, and stuck to our original plan. The only thing that we changed was to exclude the last 3 rows of data points because they were irrelevant to the landscape.
What problems were encountered during the sampling, and how were those problems overcome.
- After deciding that zero point (sea level) should be level with the planters box we experienced some issues taking measurements. We had a very difficult time take any measurements that were above zero. Audrey thought of a way to hold a meter stick at the point above zero (parallel to the ground), place a leveler on that meter stick and then to take another meter stick and measure how high the first meter stick was from the top of the planters box, it ended up working really well and allowed us to take measurements efficiently.
Conclusion
How does your sampling relate to the definition of sampling and the sampling methods out there.
- The way that we executed our sampling relates to the definition of sampling because we only took as many points of measurements that we thought would adequately depict the landscape. Taking too many points would take more time (and in a setting for a business it would take more money). And taking too little of points would not depict the landscape at all.
Why use sampling in spatial areas?
- Spatial areas can be large, and to take measurements in that area you need people, tools, and time. This can cost a lot of money but also energy. Sampling is a way to short cut those expenses in a way but still acquire accurate data.
How does this activity relate to sampling spatial data over larger areas?
- As I said above larger areas require more people, tools and time which in the long run cost more money and energy.
Using the numbers you gathered, did your survey perform an adequate job of sampling the area you were tasked to sample?
- I think the amount of sample points that we took as a group adequately depicts our landscape as a sample area. I would be curious to put this data into a computer program to see if it looks close to the real landscape we created.