Introduction
This project was meant to let us be creative in asking our own geographic question, gather the data needed and analyse the results. The research question that I decided I would like to know more about was "Are tree species affected by the flooding of the river?" In other words can only some tree species survive in flooding situations? In order to answer a question like this, the design process must be neat and effective, only gathering attributes that may reveal results to the question being asked. Domains should also be used to ensure less error when entering data out in the field. The process of this particular project design will be explained more in methods.Study Area
The study area used for this project was the land on the north and south bank of the Chippewa River located on the UW-Eau Claire campus near the walkway bridge in Eau Claire, Wisconsin. This area has experienced frequent flooding after rainfall, and snow melting in the spring. Trees are found near the river that can be within a foot of water for days at a time. So does this frequent flooding affect what trees species can survive in such stressed conditions?Methods
Before setting out and actually gathering data, the project and organization needed to be set up using ArcCatalog and ArcMap. ArcCatalog is where the geodatabase was set up and designed. For this the geodatabase was named Tree_Study.gdb and within that a point feature class named Trees was created. The Tree feature class had attribute fields created that were tree species, tree diameter (in centimeters), coniferous/deciduous, and notes. These fields were meant to help the study understand what tree species were found in the flood plain and possibly reveal why they could withstand the conditions of flooding. Each attribute field had domains created (with the exception of the notes field) to keep the data more accurate and with less errors entered out in the field.Gathering the data took place on Thursday March 31st at around 5:00 pm. The equipment used was:
- Ipad containing
- Arc collector app
- Tree identification app (LeafSnapHD)
- Bad Elf app
- Bad Elf GPS bluetooth device
- Tree caliper (used to measure the diameter of trees)


Figure 2: Bad Elf GPS device that enabled ipad to collect points

Figure 3: ArcCollector app used to create a map and collect points of Trees

Figure 4: LeafSnapHD app that helped me identify trees

Figure 5: Bad Elf GPS app

Figure 6: Tree caliper used to measure the diameter of trees
Getting started there were some technical difficulties. The Bad Elf bluetooth device would not connect with the ipad and once it did, data could not be collected. It was quickly realized that the ipad would not collect points on a map that was not already on the device itself. The map being used was downloaded to the ipad using wifi in the Human Sciences and Services building. One practice point was collected to make sure data gathering was working properly, labeled "Oak" but written in the notes it specifies this point as the practice point. Once everything was okay and working, the real data gathering started of trees near the river. Every 10-20 feet a tree was recorded that was within 15 feet of the river's edge. The tree species was recorded using the help of the tree identification app (this was rather difficult as identifying trees could only be done by looking at the bark and branching since leaves, seeds and fruit had not formed yet), the tree diameter using the tree caliper, and whether is was deciduous or coniferous. 29 tree points were collected with their corresponding attributes.

Figure 7: Screen shot from the ipad while I was collecting data out in the field
This data was then extracted from online GIS and the following maps were created in ArcMap showing each individual field that was collected about the trees. This methods should allow us to better understand the tree species and types of trees that tend to grow so close to the river. Tree diameter may reveal other questions that could be further researched.
Results

While only five different species were recorded along the river this reveals what trees can withstand the harsher environment of excess water for a given period of time. Ash trees appear to be the closest to the river bank with Elm, Oak, Birch and possibly some Maple trees scattered just a bit further inland. I say possibly Maple trees because only one was recorded, and this could have been a mis-identification. Further studies could study the distance of these trees from the river bank.

The diameters of the trees could reveal how big the trees along the river bank could grow. Possibly telling us if an excess of water impairs trees from growing past a certain diameter or if excess water allows trees to grow to a tremendous diameter. This findings don't allow us to conclude anything as tree diameter ranges from 5 to 100 centimeters. With this in mind tree growth may be entirely dependent on the tree species.
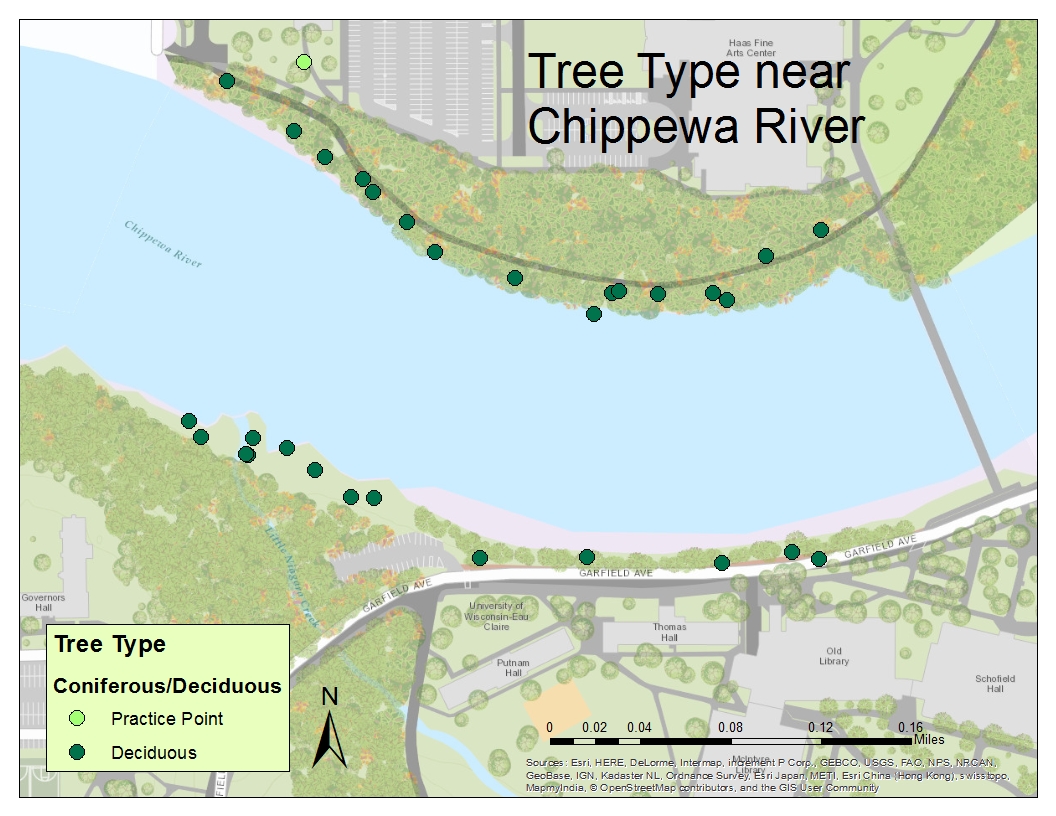
Although the above map may look boring only showing dark green dots of deciduous trees (trees that lose their leaves seasonally as opposed to coniferous trees that keep their leaf needles all year round) it does reveal the common type of tree found along the river bank of the Chippewa. This may tell us that coniferous trees cannot handle the stress of the frequent floods that occur on this river. Again more trees should be gathered in order to make these conclusions.
Conclusion
Proper project design is needed in order to keep the research project at hand neat and organized. Solutions to help this would be to create an organized geodatabase with feature datasets when needed and the corresponding feature classes. These feature classes should have domains if planning to enter attribute data in the field (most research would require this) to keep data integrity and less human error while entering data. The objectives that were executed here did mainly answer the research question, but also raised other questions that could be researched in separate projects. Things that could be changed in this design for next time would be to record more trees, possibly later in the spring and summer months so they would be easier to identify by their leaves, seeds and fruit rather than just by their bark and branching. Having a larger study area wouldn't hurt either, looking at trees farther East and West along the river.
Sources
- http://www.stihl.co.uk/STIHL-Products/Hand-Tools-and-Forestry-Accessories/Accessories-for-forestry-use/21027-1625/Tree-calipers.aspx (tree caliper image)
- http://www.apple.com/shop/buy-ipad/ipad-air-2 (ipad image)
- http://bad-elf.com/collections (bad elf GPS image)
- https://play.google.com/store/apps/details?id=com.esri.arcgis.collector (ArcCollector image)
- https://itunes.apple.com/us/app/leafsnap/id430649829?mt=8 (LeafsnapHD app image)
- https://www.appannie.com/apps/ios/app/bad-elf-gps/ (bad elf app image)
No comments:
Post a Comment